> ## Documentation Index
> Fetch the complete documentation index at: https://docs.textql.com/llms.txt
> Use this file to discover all available pages before exploring further.
# Observability
> Retrospectively review thread quality with signals, identify recurring issues, celebrate what works, and take action to improve future analysis across your organization.
 ## Overview
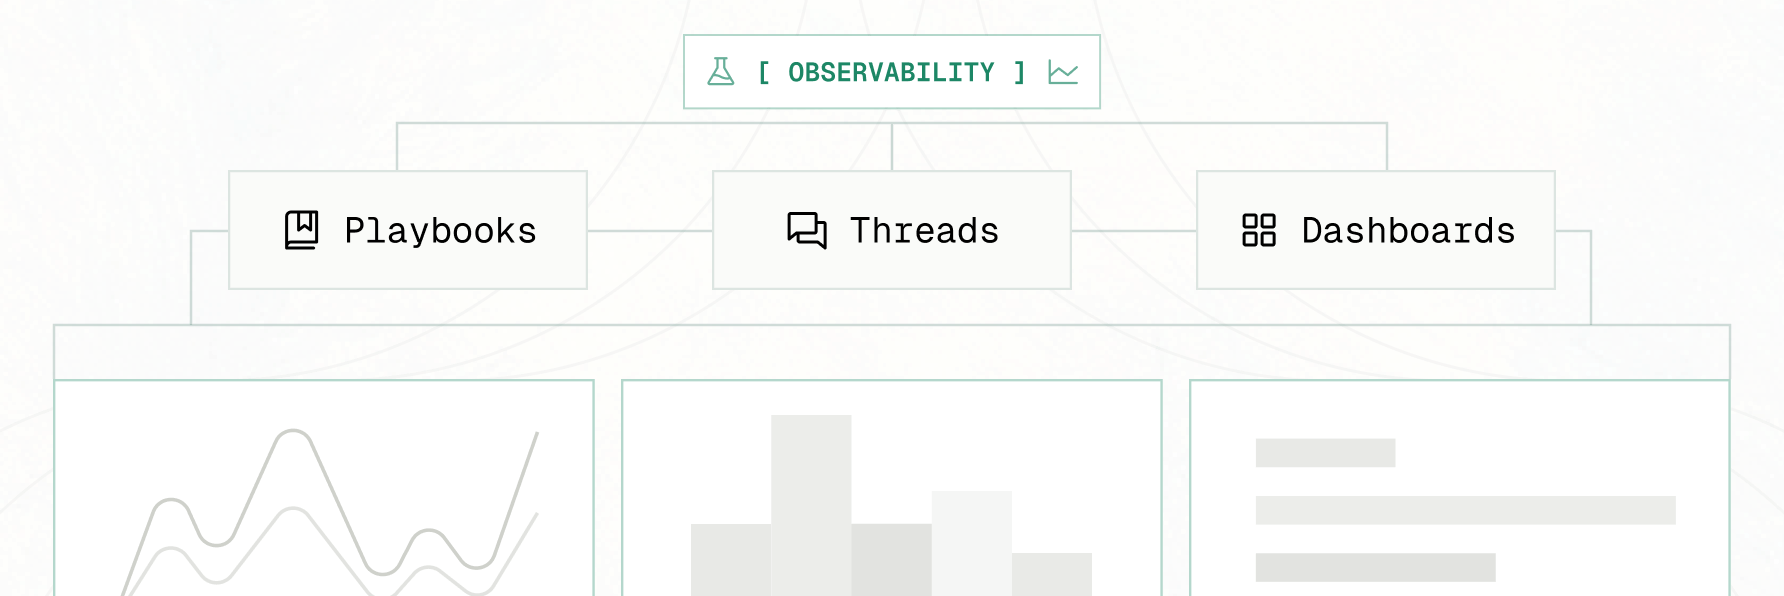
**Observability** is a retrospective tool for organization administrators. It gives you a structured view of past threads, playbook runs, agents, dashboards, and connectors across your workspace.
After threads complete, TextQL automatically analyzes them for quality **signals** — both problems (gaps in context, execution errors, signs of user frustration, potential inaccuracies) and strengths (goals achieved, explicit user satisfaction). Signals attach to individual threads, which you can drill into to understand exactly what happened.
The goal is to give administrators a systematic way to:
* **Monitor analysis quality** across your organization over time
* **Identify patterns** — recurring signal types, problematic connectors, or topic areas where Ana consistently struggles
* **Apply targeted fixes** — improving ontology coverage, enriching the Ontology, or adjusting connector configuration based on what you find
* **Recognize what works** — positive signals mark threads where users got exactly what they needed, and the People view shows who is getting great results
* **Drive user education** — spotting where users are asking questions Ana cannot yet answer well, and helping them prompt more effectively in the meantime
Access it from the left sidebar under **Observability**.
Observability is available to organization administrators only. If you do not see it in your sidebar, confirm that you have admin privileges.
***
## How Threads Are Classified
Every analyzed thread ends up in one of three states:
| State | Meaning |
| - | - |
| **Flagged** | At least one issue signal was detected (by a detector, the quality evaluator, or a user thumbs-down) |
| **Positive** | Only strength signals — an explicit thumbs-up, or evaluator-verified good outcomes |
| **Clean** | Analyzed, nothing notable in either direction — the expected majority |
Threads created before analysis ran show as **Pending** until scanned. A thread can carry both issue and strength signals (for example a thumbs-up alongside a slow query); it counts as flagged, and both signals are shown.
There is deliberately no mechanical path to a positive state: successful tool calls are the baseline, not evidence of a good outcome. A thread earns a strength signal only from explicit user feedback or evaluator-verified evidence, so positive signals stay rare and meaningful.
***
## Time Range
Use the time range selector (top right) to control the window of data shown across all tabs. Options are **Last 7 days**, **Last 14 days**, **Last 30 days**, and **Last 90 days**.
***
## Overview Tab
The Overview tab is the main monitoring surface. It shows thread and playbook activity, signal trends, and ontology health at a glance.
### Stats Bar
Summary cards at the top show aggregate metrics for the selected time range, each with a delta vs. the previous equivalent period:
* **Total Runs** — all thread runs across the workspace
* **Playbook Runs** — runs triggered by scheduled playbooks
* **Slack** — runs initiated via the Slack integration
* **Feed Agents** — visible when Feed Agents are enabled or when feed agent activity exists in the selected range
* **Signals** — threads with at least one issue detected, with a flagged-rate percentage
* **Positive** — threads with at least one strength signal (shown when any exist)
### Run Volume Chart
A bar chart breaking down run volume over time, color-coded by source: Threads, Playbooks, Slack, and Feed Agents.
### Signal Breakdown
Next to the run volume chart, the **Signal Breakdown** panel charts signal volume over time by type. Click any signal type to filter down to threads carrying that signal.
Signals are color-coded by category:
* **Causes** (blue) — configuration issues you can fix
* **Symptoms** (orange) — execution problems
* **Outcomes** (red) — user-facing impact
* **Strengths** (green) — positive outcomes
### Signal Types
#### Causes — Configuration issues you can fix
These signals indicate that the agent lacked the information it needed. Fixing them usually means improving your ontology or semantic layer.
| Signal | Severity | What it means | Suggested action |
| - | - | - | - |
| **Missing context** | High | The agent lacked ontology or semantic layer information needed to answer accurately | Add missing table/column descriptions to the semantic layer, or onboard the relevant data source |
#### Symptoms — Execution problems
These signals indicate something went wrong while the agent was running.
| Signal | Severity | What it means | Suggested action |
| - | - | - | - |
| **Error loop** | High | The agent hit 5+ consecutive execution errors | Review the error messages and check if the agent is retrying a fundamentally broken approach |
| **Excessive tool calls** | Medium | A single turn made 20+ tool calls | Review the conversation for unnecessary retries or redundant tool usage; consider improving prompt instructions |
| **Slow query** | Medium | A SQL query ran at or above the slow-query threshold for its connector | Review the query plan for missing indexes or expensive joins; consider materializing frequently-queried aggregations |
| **No results** | Low | The final query returned an empty result set unexpectedly | Verify the data exists for the queried time range; check filters and join conditions in the generated SQL |
#### Outcomes — User-facing impact
These signals indicate the user had a negative experience.
| Signal | Severity | What it means | Suggested action |
| - | - | - | - |
| **User frustration** | Varies | The user expressed frustration or had to repeat their question | Review the agent's responses for accuracy; consider adding example queries or refining prompt instructions |
| **Potential hallucination** | Varies | The agent may have presented fabricated or inaccurate data | Verify the data accuracy; review the SQL query logic and ensure the ontology mappings are correct |
| **Ignored instruction** | Varies | Ana skipped, missed, or refused a specific instruction the user gave | Review the conversation to see which instruction was missed; consider improving prompt instructions or adding context |
| **No conclusion** | Varies | The thread ended without the agent delivering an answer to the user's question | Review where the agent stalled — missing context, unclear ontology, or a tool/permission gap |
| **Thumbs-down** | High | A user explicitly rated a response with a thumbs-down | Open the thread and review the rated response |
#### Strengths — Positive outcomes
These signals mark threads that demonstrably went well. They never count toward the flagged rate.
| Signal | What it means |
| - | - |
| **Thumbs-up** | A user explicitly rated a response with a thumbs-up |
| **Goal achieved** | The user's core request was fully answered with a concrete, grounded deliverable |
| **User satisfaction** | The user explicitly expressed satisfaction with the agent's work |
***
## Thread Insights Tab
The Thread Insights tab lists every thread and playbook run within the selected time range, with a filter bar for source, signal type, topics, users, and date. Threads with issues carry an amber count pill; threads with strengths carry a green one.
Selecting a thread opens the **Thread Insights** panel:
| Tab | What it shows |
| - | - |
| **Signals** | All signals detected on this thread, with description and a recommendation (for issues) or takeaway (for strengths) |
| **Timeline** | Total duration, LLM vs. execution time split, and a turn-by-turn breakdown |
| **Stats** | High-level stats: total duration, turns, steps, LLM time, and execution time |
For issue signals, **Fix with Ana** opens a chat seeded with the thread's context to work on the underlying problem.
***
## People Tab
The People tab shows activity, cost, and result quality by individual team member.
### Analytics Cards
* **Active People** — how many members were active in the period, with trend over time (new vs. returning)
* **Engagement spectrum** — the distribution of members from power users to never-active
* **Access channel / method** — how people reach TextQL
### People Table
| Column | Description |
| - | - |
| **User** | Member email and display name |
| **Threads** | Number of threads started |
| **Playbooks** | Number of playbook runs attributed to this member |
| **Dashboards** | Number of dashboard views |
| **Agents** | Number of feed agents owned |
| **Activity** | Activity level over the selected period |
| **Signals** | Result quality: ↑ positive signals (green) and ↓ issues (red) on this member's threads in the period |
| **ACUs** | Total ACUs consumed |
Click a member to open their detail panel: cost attribution, usage, and a **Result Quality** section showing positive signals, issues, and how many of their analyzed threads were flagged. A flagged-rate percentage is shown once a member has at least 5 analyzed threads — below that, the sample is too small to be a fair rate.
Signal counts describe threads, not people. A member with many flagged threads usually points at a gap in context, connectors, or ontology coverage for the questions they ask — treat it as a roadmap for fixes, not a scorecard.
***
## Ontology Health Tab
The Ontology Health tab shows a health verdict and KPIs for your ontology alongside the most-relied-on and dead files, and is the entry point to the Checks board. See [What is Ontology?](/core/ontology/overview).
***
## Resources Tab
The Resources tab consolidates per-resource usage views:
### Agents
Activity and performance for [Feed Agents](/core/how-it-works/feed/agents): runs, frequency, ACUs, signals detected on the latest run, and status.
### Playbooks
Scheduled [Playbook](/core/how-it-works/playbooks) usage: run counts, LLM vs. compute ACU breakdown, and status.
### Dashboards / Apps
Usage and cost for [Dashboards](/core/how-it-works/dashboards) or Apps: views, refreshes, and ACUs.
### Connectors
Health and usage for every [data connector](/core/datasources/the-connectors-page): queries, error rate, average time, distinct users, and last-queried time. High error rates typically indicate schema mismatches, permission issues, or stale ontology definitions.
***
## Backfilling Signals
New threads are analyzed automatically shortly after the conversation goes quiet. Threads created before Observability was enabled will not have signals attached. To analyze older threads, use **Scan for Signals**.
## Overview
**Observability** is a retrospective tool for organization administrators. It gives you a structured view of past threads, playbook runs, agents, dashboards, and connectors across your workspace.
After threads complete, TextQL automatically analyzes them for quality **signals** — both problems (gaps in context, execution errors, signs of user frustration, potential inaccuracies) and strengths (goals achieved, explicit user satisfaction). Signals attach to individual threads, which you can drill into to understand exactly what happened.
The goal is to give administrators a systematic way to:
* **Monitor analysis quality** across your organization over time
* **Identify patterns** — recurring signal types, problematic connectors, or topic areas where Ana consistently struggles
* **Apply targeted fixes** — improving ontology coverage, enriching the Ontology, or adjusting connector configuration based on what you find
* **Recognize what works** — positive signals mark threads where users got exactly what they needed, and the People view shows who is getting great results
* **Drive user education** — spotting where users are asking questions Ana cannot yet answer well, and helping them prompt more effectively in the meantime
Access it from the left sidebar under **Observability**.
Observability is available to organization administrators only. If you do not see it in your sidebar, confirm that you have admin privileges.
***
## How Threads Are Classified
Every analyzed thread ends up in one of three states:
| State | Meaning |
| - | - |
| **Flagged** | At least one issue signal was detected (by a detector, the quality evaluator, or a user thumbs-down) |
| **Positive** | Only strength signals — an explicit thumbs-up, or evaluator-verified good outcomes |
| **Clean** | Analyzed, nothing notable in either direction — the expected majority |
Threads created before analysis ran show as **Pending** until scanned. A thread can carry both issue and strength signals (for example a thumbs-up alongside a slow query); it counts as flagged, and both signals are shown.
There is deliberately no mechanical path to a positive state: successful tool calls are the baseline, not evidence of a good outcome. A thread earns a strength signal only from explicit user feedback or evaluator-verified evidence, so positive signals stay rare and meaningful.
***
## Time Range
Use the time range selector (top right) to control the window of data shown across all tabs. Options are **Last 7 days**, **Last 14 days**, **Last 30 days**, and **Last 90 days**.
***
## Overview Tab
The Overview tab is the main monitoring surface. It shows thread and playbook activity, signal trends, and ontology health at a glance.
### Stats Bar
Summary cards at the top show aggregate metrics for the selected time range, each with a delta vs. the previous equivalent period:
* **Total Runs** — all thread runs across the workspace
* **Playbook Runs** — runs triggered by scheduled playbooks
* **Slack** — runs initiated via the Slack integration
* **Feed Agents** — visible when Feed Agents are enabled or when feed agent activity exists in the selected range
* **Signals** — threads with at least one issue detected, with a flagged-rate percentage
* **Positive** — threads with at least one strength signal (shown when any exist)
### Run Volume Chart
A bar chart breaking down run volume over time, color-coded by source: Threads, Playbooks, Slack, and Feed Agents.
### Signal Breakdown
Next to the run volume chart, the **Signal Breakdown** panel charts signal volume over time by type. Click any signal type to filter down to threads carrying that signal.
Signals are color-coded by category:
* **Causes** (blue) — configuration issues you can fix
* **Symptoms** (orange) — execution problems
* **Outcomes** (red) — user-facing impact
* **Strengths** (green) — positive outcomes
### Signal Types
#### Causes — Configuration issues you can fix
These signals indicate that the agent lacked the information it needed. Fixing them usually means improving your ontology or semantic layer.
| Signal | Severity | What it means | Suggested action |
| - | - | - | - |
| **Missing context** | High | The agent lacked ontology or semantic layer information needed to answer accurately | Add missing table/column descriptions to the semantic layer, or onboard the relevant data source |
#### Symptoms — Execution problems
These signals indicate something went wrong while the agent was running.
| Signal | Severity | What it means | Suggested action |
| - | - | - | - |
| **Error loop** | High | The agent hit 5+ consecutive execution errors | Review the error messages and check if the agent is retrying a fundamentally broken approach |
| **Excessive tool calls** | Medium | A single turn made 20+ tool calls | Review the conversation for unnecessary retries or redundant tool usage; consider improving prompt instructions |
| **Slow query** | Medium | A SQL query ran at or above the slow-query threshold for its connector | Review the query plan for missing indexes or expensive joins; consider materializing frequently-queried aggregations |
| **No results** | Low | The final query returned an empty result set unexpectedly | Verify the data exists for the queried time range; check filters and join conditions in the generated SQL |
#### Outcomes — User-facing impact
These signals indicate the user had a negative experience.
| Signal | Severity | What it means | Suggested action |
| - | - | - | - |
| **User frustration** | Varies | The user expressed frustration or had to repeat their question | Review the agent's responses for accuracy; consider adding example queries or refining prompt instructions |
| **Potential hallucination** | Varies | The agent may have presented fabricated or inaccurate data | Verify the data accuracy; review the SQL query logic and ensure the ontology mappings are correct |
| **Ignored instruction** | Varies | Ana skipped, missed, or refused a specific instruction the user gave | Review the conversation to see which instruction was missed; consider improving prompt instructions or adding context |
| **No conclusion** | Varies | The thread ended without the agent delivering an answer to the user's question | Review where the agent stalled — missing context, unclear ontology, or a tool/permission gap |
| **Thumbs-down** | High | A user explicitly rated a response with a thumbs-down | Open the thread and review the rated response |
#### Strengths — Positive outcomes
These signals mark threads that demonstrably went well. They never count toward the flagged rate.
| Signal | What it means |
| - | - |
| **Thumbs-up** | A user explicitly rated a response with a thumbs-up |
| **Goal achieved** | The user's core request was fully answered with a concrete, grounded deliverable |
| **User satisfaction** | The user explicitly expressed satisfaction with the agent's work |
***
## Thread Insights Tab
The Thread Insights tab lists every thread and playbook run within the selected time range, with a filter bar for source, signal type, topics, users, and date. Threads with issues carry an amber count pill; threads with strengths carry a green one.
Selecting a thread opens the **Thread Insights** panel:
| Tab | What it shows |
| - | - |
| **Signals** | All signals detected on this thread, with description and a recommendation (for issues) or takeaway (for strengths) |
| **Timeline** | Total duration, LLM vs. execution time split, and a turn-by-turn breakdown |
| **Stats** | High-level stats: total duration, turns, steps, LLM time, and execution time |
For issue signals, **Fix with Ana** opens a chat seeded with the thread's context to work on the underlying problem.
***
## People Tab
The People tab shows activity, cost, and result quality by individual team member.
### Analytics Cards
* **Active People** — how many members were active in the period, with trend over time (new vs. returning)
* **Engagement spectrum** — the distribution of members from power users to never-active
* **Access channel / method** — how people reach TextQL
### People Table
| Column | Description |
| - | - |
| **User** | Member email and display name |
| **Threads** | Number of threads started |
| **Playbooks** | Number of playbook runs attributed to this member |
| **Dashboards** | Number of dashboard views |
| **Agents** | Number of feed agents owned |
| **Activity** | Activity level over the selected period |
| **Signals** | Result quality: ↑ positive signals (green) and ↓ issues (red) on this member's threads in the period |
| **ACUs** | Total ACUs consumed |
Click a member to open their detail panel: cost attribution, usage, and a **Result Quality** section showing positive signals, issues, and how many of their analyzed threads were flagged. A flagged-rate percentage is shown once a member has at least 5 analyzed threads — below that, the sample is too small to be a fair rate.
Signal counts describe threads, not people. A member with many flagged threads usually points at a gap in context, connectors, or ontology coverage for the questions they ask — treat it as a roadmap for fixes, not a scorecard.
***
## Ontology Health Tab
The Ontology Health tab shows a health verdict and KPIs for your ontology alongside the most-relied-on and dead files, and is the entry point to the Checks board. See [What is Ontology?](/core/ontology/overview).
***
## Resources Tab
The Resources tab consolidates per-resource usage views:
### Agents
Activity and performance for [Feed Agents](/core/how-it-works/feed/agents): runs, frequency, ACUs, signals detected on the latest run, and status.
### Playbooks
Scheduled [Playbook](/core/how-it-works/playbooks) usage: run counts, LLM vs. compute ACU breakdown, and status.
### Dashboards / Apps
Usage and cost for [Dashboards](/core/how-it-works/dashboards) or Apps: views, refreshes, and ACUs.
### Connectors
Health and usage for every [data connector](/core/datasources/the-connectors-page): queries, error rate, average time, distinct users, and last-queried time. High error rates typically indicate schema mismatches, permission issues, or stale ontology definitions.
***
## Backfilling Signals
New threads are analyzed automatically shortly after the conversation goes quiet. Threads created before Observability was enabled will not have signals attached. To analyze older threads, use **Scan for Signals**.
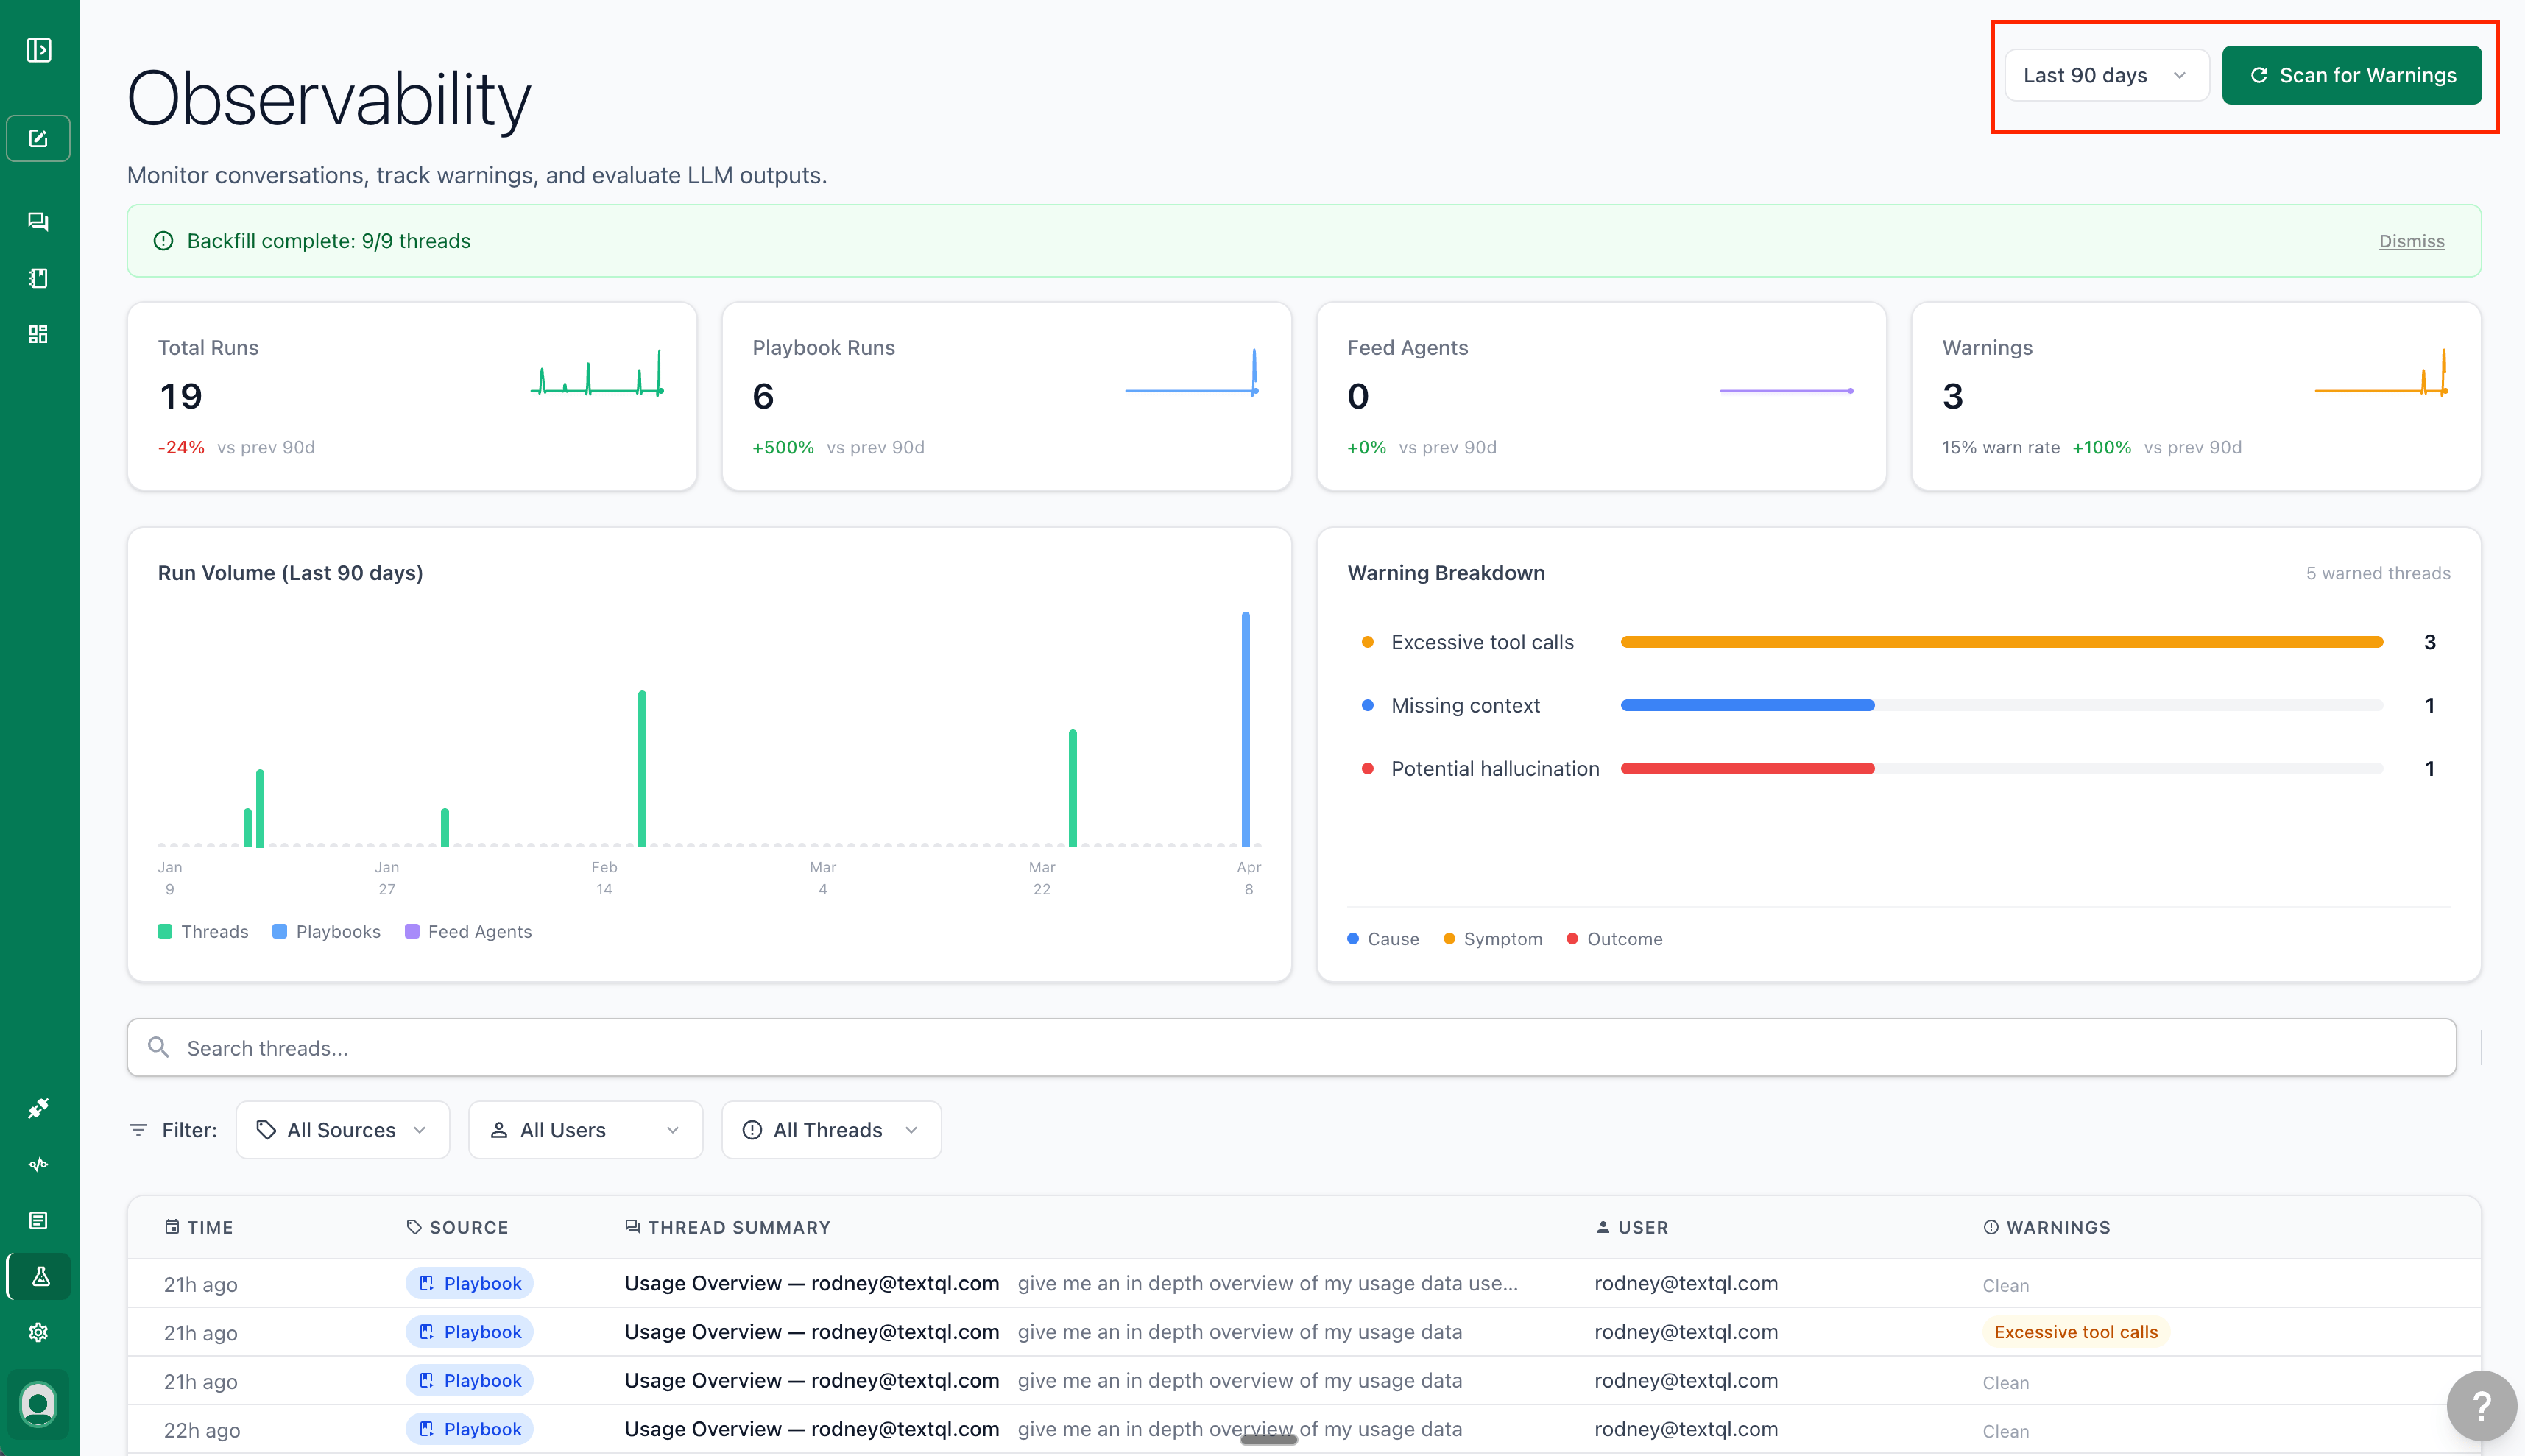 If unanalyzed threads are detected, a **Scan for Signals** button appears in the page header. Clicking it opens a modal to configure the scan:
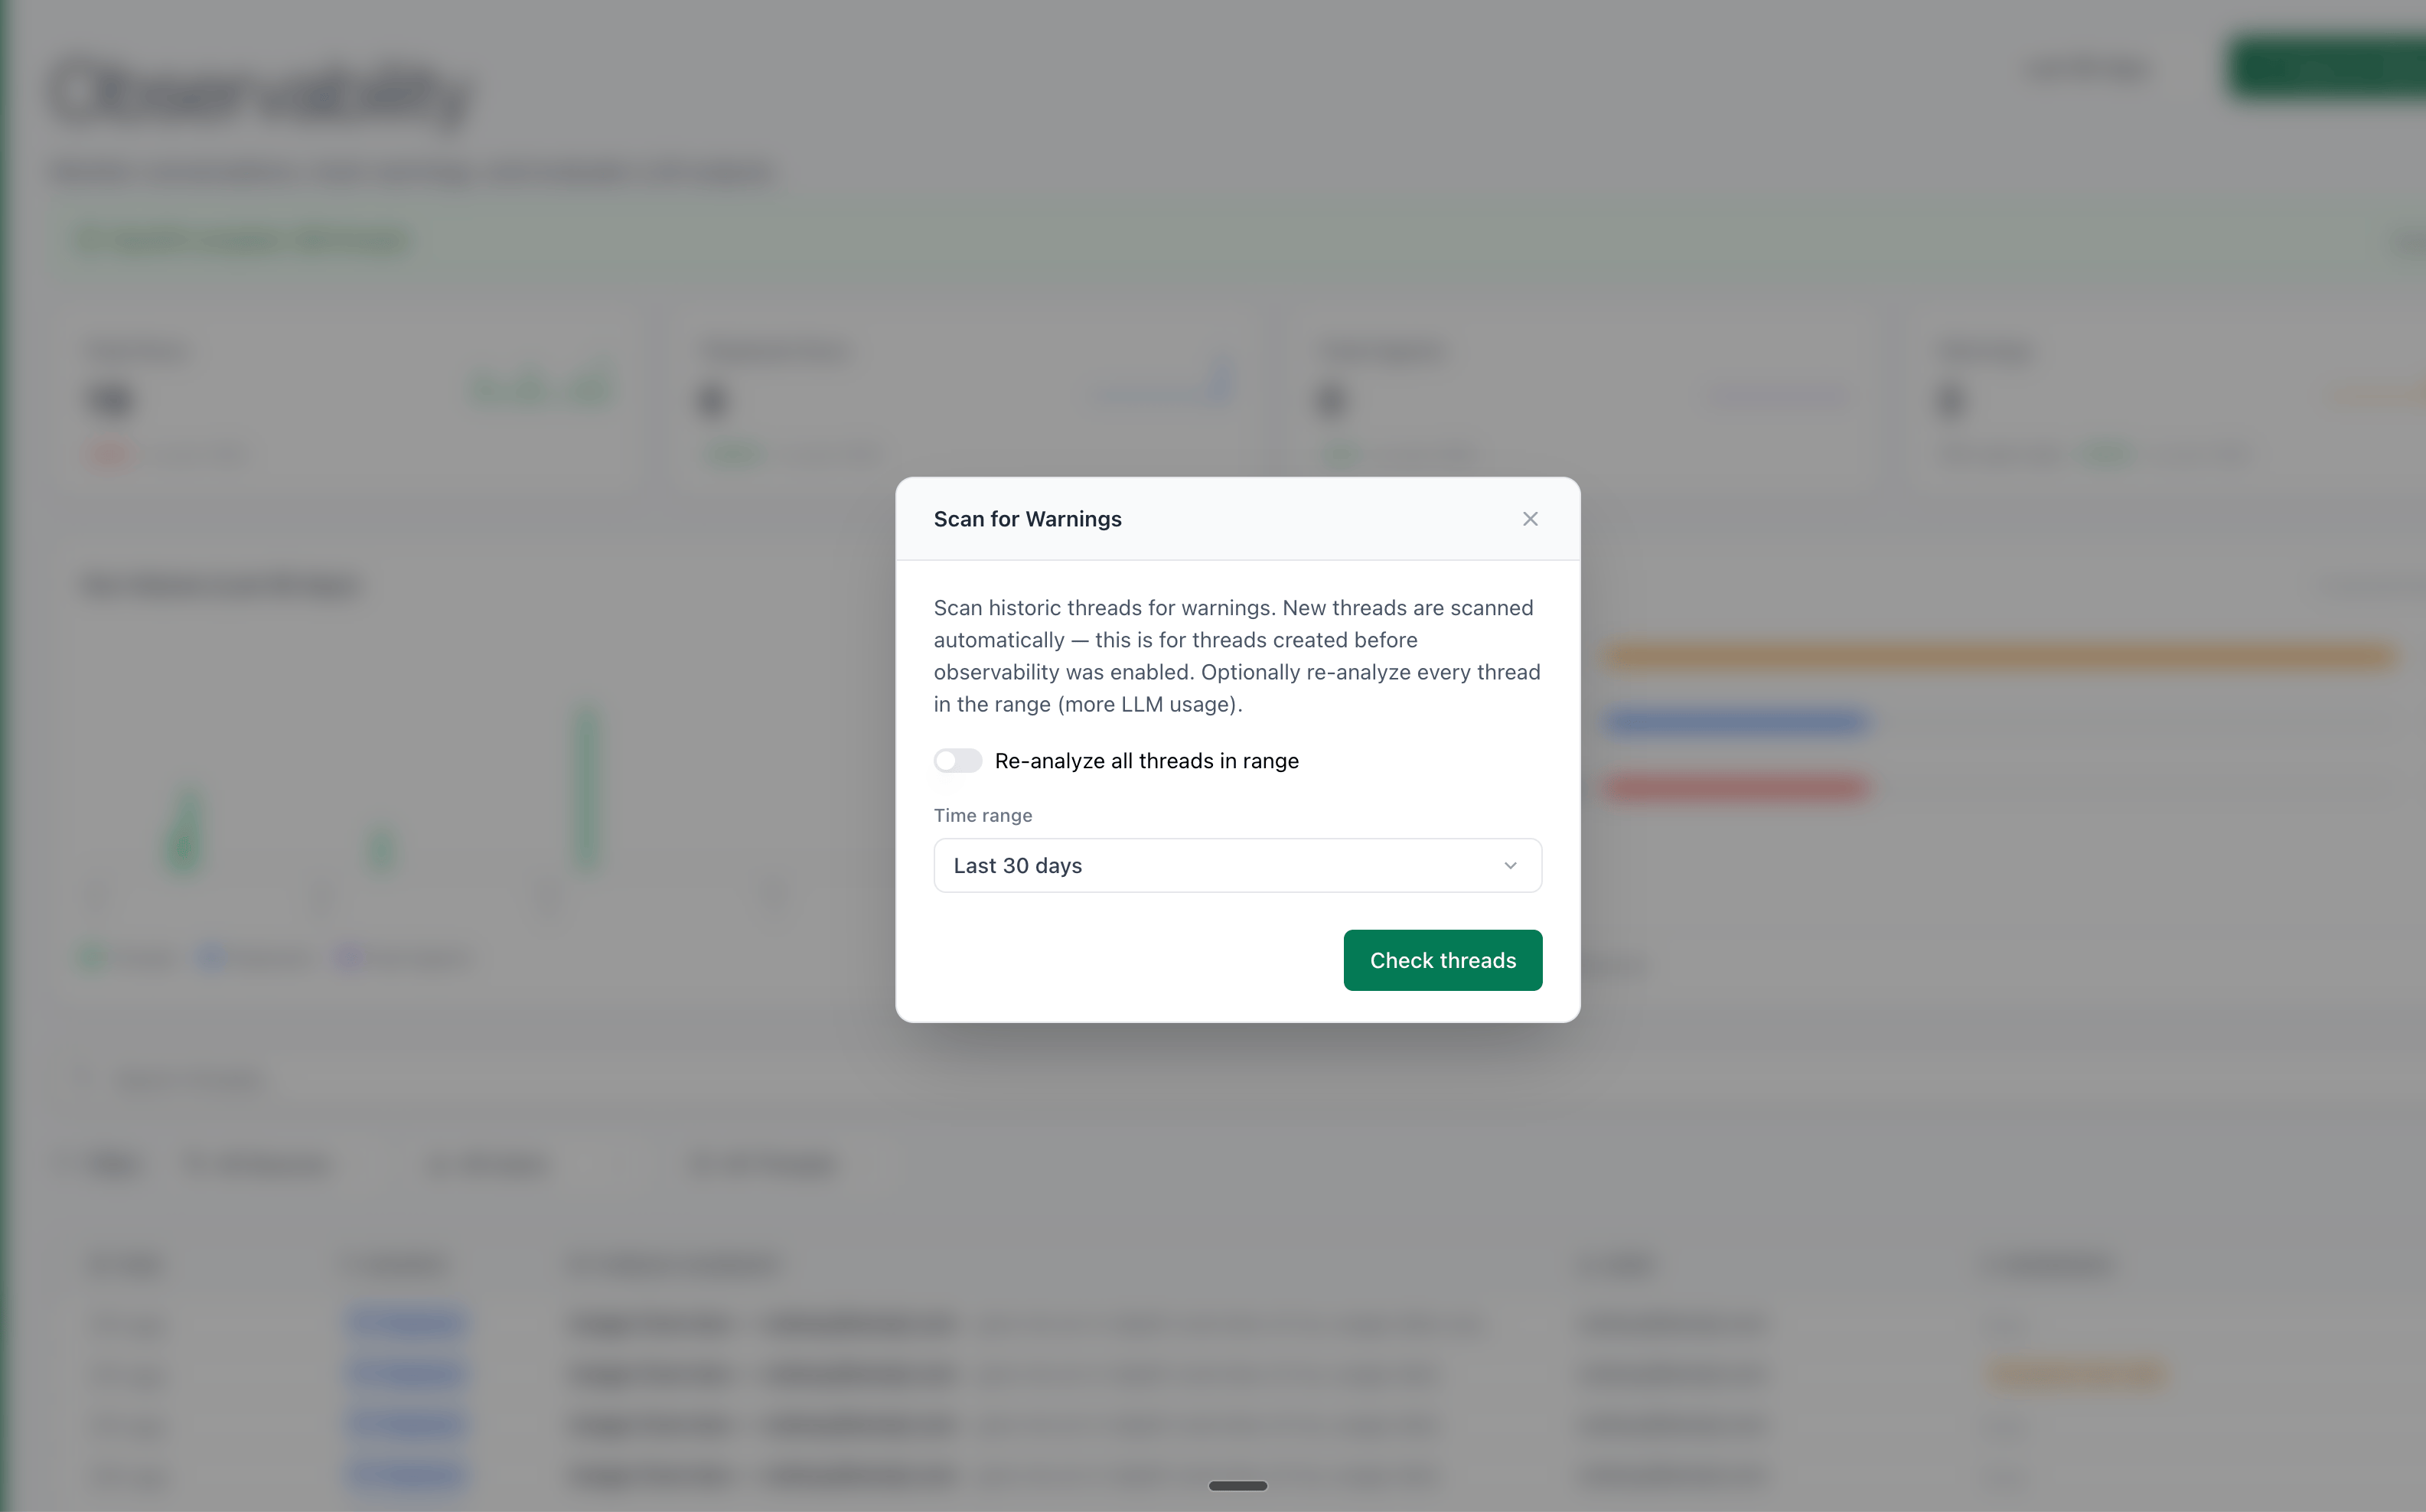 * **Time range** — Choose how far back to scan: Last 7 days, Last 14 days, Last 30 days, or Last 90 days
* **Re-analyze all threads in range** — When enabled, re-evaluates every thread in the range including already-analyzed ones. Off by default.
Click **Check threads** to preview how many threads will be scanned, then **Analyze N threads** to start. A progress banner shows how many threads have been processed. The dashboard refreshes automatically once complete.
***
## Further Reading
* [Setting Up Context for Best Results](/core/get-better-results/setting-up-context) — act on what you find by improving your context and metric definitions
* [What is Ontology?](/core/ontology/overview) — close ontology gaps surfaced by Observability signals
* [Writing Better Prompts](/core/get-better-results/writing-better-prompts) — share with users whose threads show recurring issues
## Need Help?
If you're seeing signals you don't know how to resolve, or Observability isn't behaving as expected, contact support at [support@textql.com](mailto:support@textql.com).
This documentation is built and hosted on [Mintlify](https://mintlify.com), a developer documentation platform.
* **Time range** — Choose how far back to scan: Last 7 days, Last 14 days, Last 30 days, or Last 90 days
* **Re-analyze all threads in range** — When enabled, re-evaluates every thread in the range including already-analyzed ones. Off by default.
Click **Check threads** to preview how many threads will be scanned, then **Analyze N threads** to start. A progress banner shows how many threads have been processed. The dashboard refreshes automatically once complete.
***
## Further Reading
* [Setting Up Context for Best Results](/core/get-better-results/setting-up-context) — act on what you find by improving your context and metric definitions
* [What is Ontology?](/core/ontology/overview) — close ontology gaps surfaced by Observability signals
* [Writing Better Prompts](/core/get-better-results/writing-better-prompts) — share with users whose threads show recurring issues
## Need Help?
If you're seeing signals you don't know how to resolve, or Observability isn't behaving as expected, contact support at [support@textql.com](mailto:support@textql.com).
This documentation is built and hosted on [Mintlify](https://mintlify.com), a developer documentation platform.